Today, large corporations rely heavily on data analytics to structure and run their daily operations. These datasets serve a wide range of uses, from informing operational decisions to shaping marketing strategy.
In fact, today's market dynamics are directly tied to how data is analyzed and interpreted. The steady growth in the volume of stored information is a clear, unmistakable trend for the years ahead.
Leading firms in the monitoring space see this as a decisive factor. One example is research by BCG (Boston Consulting Group) in collaboration with Red Hat: in 2021, total data volume reached 84 ZB, and it is projected to hit 149 ZB by 2024, an increase of 77.38%.
Managing this enormous volume of data has also proven a considerable challenge for companies, since balancing the costs of storage, networking, processing and security is difficult and highly expensive.
On the Databricks Lakehouse platform, the main cost components are Virtual Machines and Databricks Units (DBUs).
Virtual Machines for massive processing
Virtual Machines are used to provision Databricks clusters and process data. The larger the Virtual Machine configuration, the more processing power it delivers, and the higher the associated infrastructure costs.
Databricks Units (DBUs) for pricing
The Databricks Unit (DBU) is the metric the Databricks Lakehouse uses to measure processing capacity and calculate platform costs. The number of DBUs a workload requires is determined by both processing capacity and the volume of data processed. Simply put, a larger cluster (with more and bigger Virtual Machines) consumes more DBUs, delivering more data processing power.
The actual cost of DBUs varies by workload type, as shown in the table below:

Source: https://www.databricks.com/product/pricing – Note: prices may vary by region.
All major cloud providers, such as Azure, AWS and GCP, offer monitoring tools to help manage costs. However, they are not flexible enough, or they require significant effort to extract information in the way the business needs.
Enhancing cost monitoring with Unity Catalog
Unity Catalog is a centralized data governance solution that gives you full control of your Databricks Lakehouse. Adopting it takes data pipeline monitoring to the next level, adding observability over the data stored in the Lakehouse as well as operational intelligence on access, costs, auditing, lineage and more, through system tables.
By default, system tables are not available for querying in Unity Catalog, as shown in the image below:
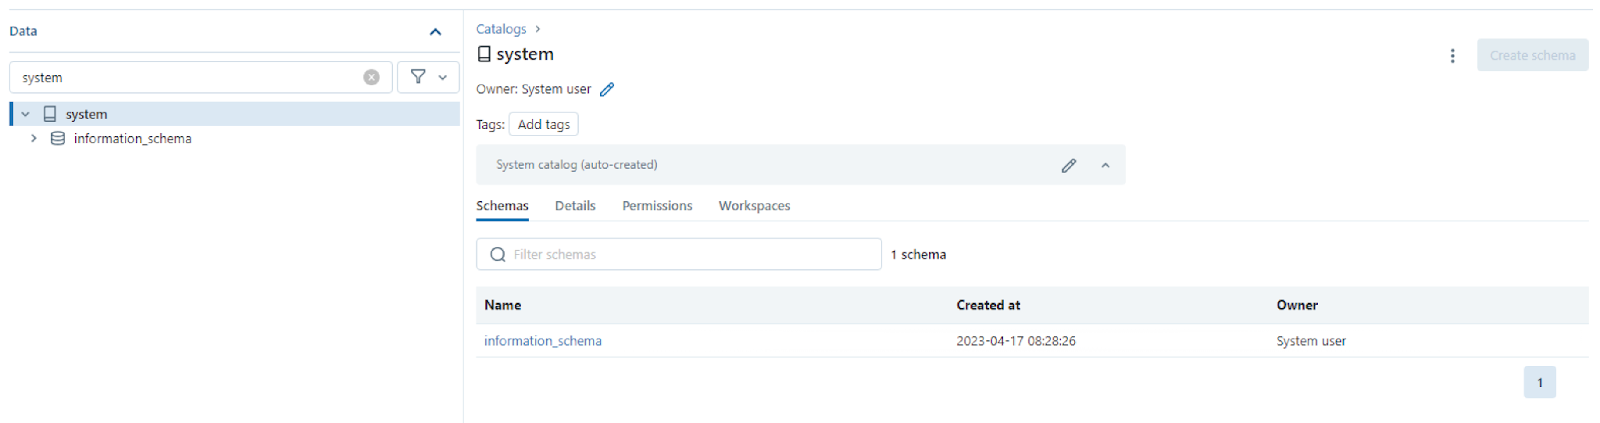
Enabling System Table visibility
Although the tables are not accessible by default, you can enable them through the Unity Catalog REST APIs.
To enable access to system tables, follow the instructions at this link: https://docs.databricks.com/en/administration-guide/system-tables/index.html#enable-system-tables
Voilà!

For our specific scenario, the key system table is “system.billing.usage.” It contains DBU consumption data for every workspace in the Databricks account, regardless of the region where each workspace was created.

Achieving Cost Observability and Predictability
Combined with proper tagging of Databricks resources, you can gain detailed insights into DBU consumption, such as:
- Data Pipelines
- Business Areas
- Workloads
- Peak Usage Hours
- Workspaces
This consumption data is vital for improving governance of the analytics environment, in terms of both costs and data (deviation and anomaly detection).
Leveraging the Databricks Lakehouse Platform
The Databricks Lakehouse platform provides a comprehensive solution that simplifies operational intelligence. By combining Dashboards, Saved Queries and Databricks SQL Serverless, you can build visualizations and charts intuitively. Dashboard refreshes can be scheduled to match your business needs.
The platform also lets you set up alerts that notify owners of scenarios or deviations requiring immediate action.

Example of a cost predictability dashboard in BRL and DBUs

Example of a monthly Jobs consumption history chart
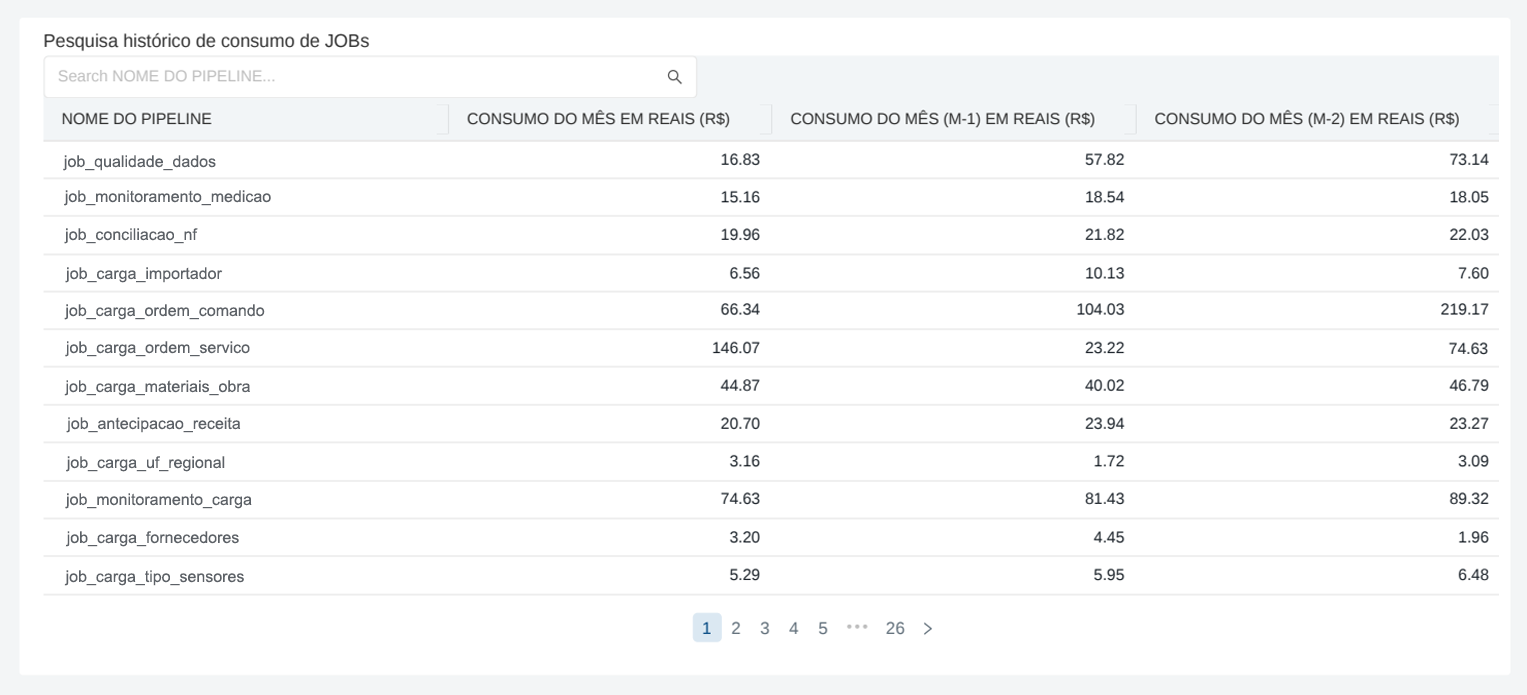
Example of a cost-per-data-pipeline query

Example of a monthly consumption history chart by workload type
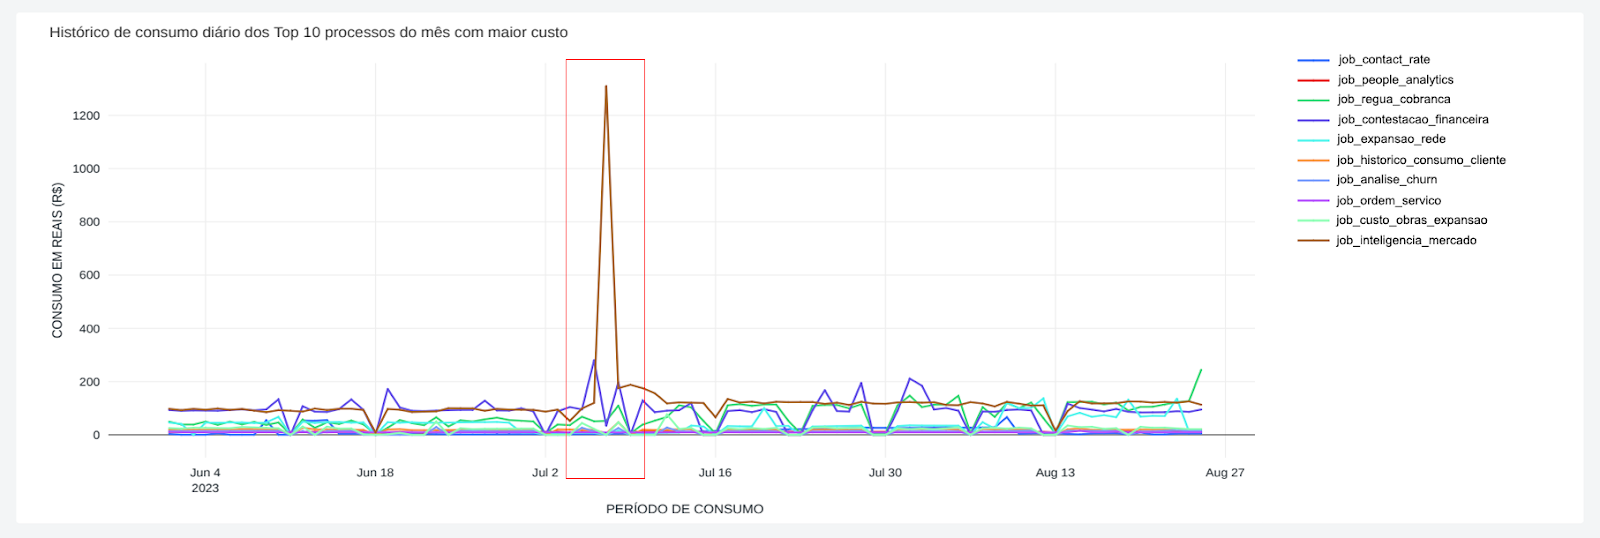
Example of a daily Jobs consumption history chart with anomaly detection
Conclusion
These are just a few of the many insights you can generate to monitor the costs of your Databricks environment using Dashboards, Saved Queries and Databricks SQL Serverless together with the metadata managed by Unity Catalog.
Unity Catalog system tables are in “Public Preview,” but they already provide key metrics for improving Databricks Lakehouse operations. Unity Catalog is constantly evolving, and over time we expect new metrics to become available to further strengthen governance of the analytics environment.
Limitations
System tables are in public preview and are not updated in real time.
The Digiage and Databricks partnership:
Digiage is an official Databricks partner and has stood out in modernizing Data Lake architectures across a range of industries, including retail, automotive, utilities, telecommunications and financial services. Digiage has also driven operational improvements for its clients by implementing generative AI.
Want to learn more? Contact Digiage …
Authors
Daniel Antonelli – Data & Analytics Solutions Architect
Gregory Miguel – Head of Data & Analytics